


Key Services: Data Engineering and Analytical Solution
Client:
One of the leading inventory analytics consulting firm operating in the USA. It collects 3 different sets of data (a) Inventory of all food items with their location details, cost details, inventory description, etc. (b) Quality Check on Hold (i..e items that are under quality check and about to be released to the market for consumption (c) Usage data of consumables for the past 10 weeks (it is rolling 10 weeks).
Challenge:
The client used to manage the analytics earlier using excel sheets and macros. It was a laborious process, prone to manual errors. Data size could not be handled by the Client in the excel sheet. Dissemination of information and analytics was always a challenge for the client in simple excel sheets. Excel does not allow any drill-down capability and other features which comes in handy analytical tools.
Our Strategy:
The vision of chimera is to automate the entire workflow without any manual intervention and make the analytics look like a product by itself. This means any new or existing end-customer of the client can perform robust analytics in a self-serviced manner without any external technical help. Just like an auto-pilot mode.
Our Solution:
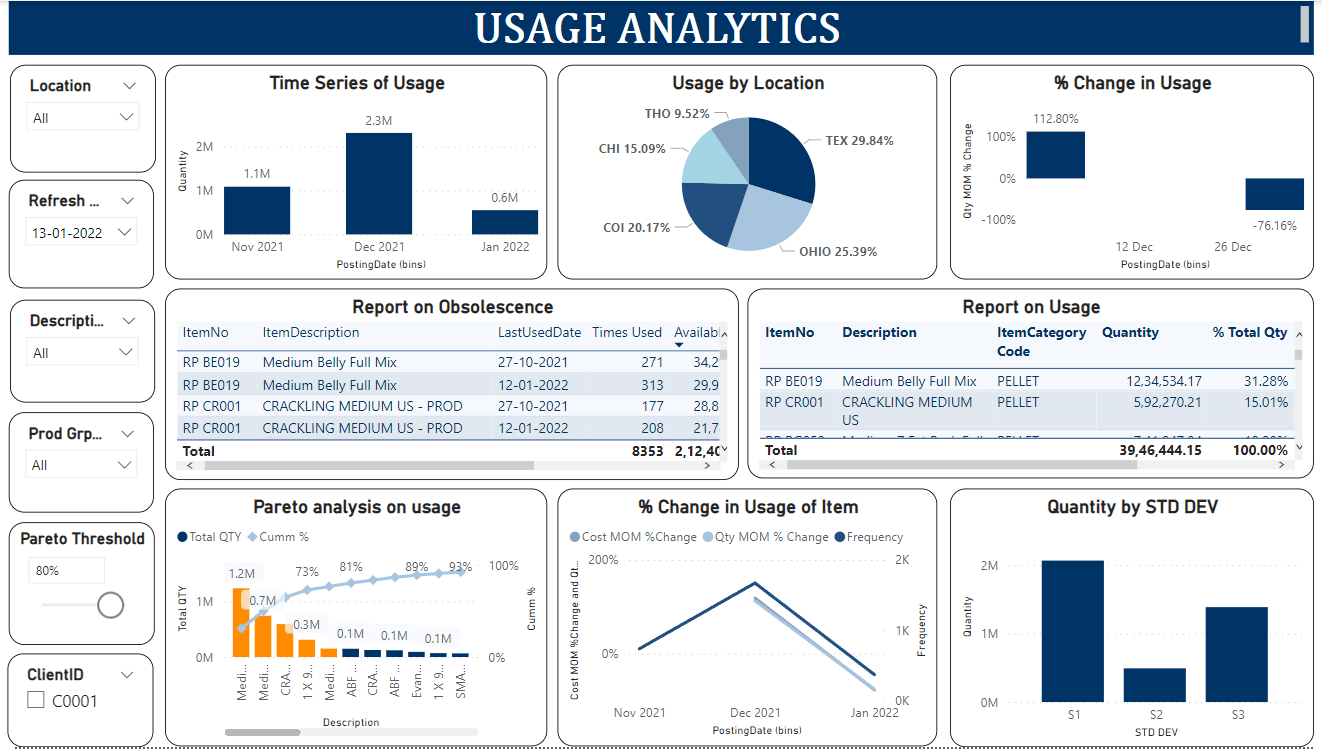
Each inventory item comes with an expiry date, so first thing is that how many days are left for each inventory to expire has to be determined. Secondly, based on the usage data, the trend of consumption for each product will be calculated. If the trend continues at the same level, will the product be sold before the expiry date or not has to be determined? For example, there are 100 units of Fruit jam available in 4 locations and the expiry date is 10 weeks from now for all the 100 units. The past trend shows each week only 8 units are getting sold (derived from usage data), now if the same trend continues, at the end of 10 weeks, only 80 units will get sold and 20 units will get expired. hence the fruit jam product is at risk. However, this may not be the case at all locations, so in some locations, it may be at risk, and in some other locations it may not be at risk.
Chimera used Azure Data Factory to create a pipeline to automatically push/pull excel sheets from a specific location, created data lakes, and report ready database with all the required transformations and quality checks to generate Pre-built analytical solutions on the power bi dash board. From the scratch, Chimera took 8 weeks to complete the work.
Business Outcome:
- It helps the customer to plan the availability of the product in the market.
- They can increase or decrease production.
- It helps the movement of goods from one location to another based on demand.
- It helps to strategise the client to offer discounts like Buy 1 Get 1 free for faster clearance of stock.
Tech Stack:
Azure Data Factory, Power BI