Client:
In today’s fast-paced business environment, effective project management is crucial for success. However, traditional project management status reporting often falls short in providing timely, relevant, and actionable insights. This case study explores how a leading multinational corporation headquartered in Singapore transformed its project management status reporting system to drive faster decision-making, deeper insights, and enhanced data-driven strategies.
Challenge:
The client’s existing project management dashboard was static and lacked intuitive features and interactivity. This hindered stakeholders from efficiently extracting insights across diverse projects and sprints. Furthermore, the dashboard was not aligned with the company’s branding standards, impacting its effectiveness and user engagement.
Our Solution:
To address these challenges, we proposed transitioning to a Power BI dashboard designed to resemble a web-like interface. This approach is to seamlessly embed the dashboard into the client’s project management portal, enhancing user experience and promoting engagement. The data from various projects is stored in a data lake. This allows us to connect the data directly, analyze it, and introduce new metrics for deeper insights.
Our Strategy:
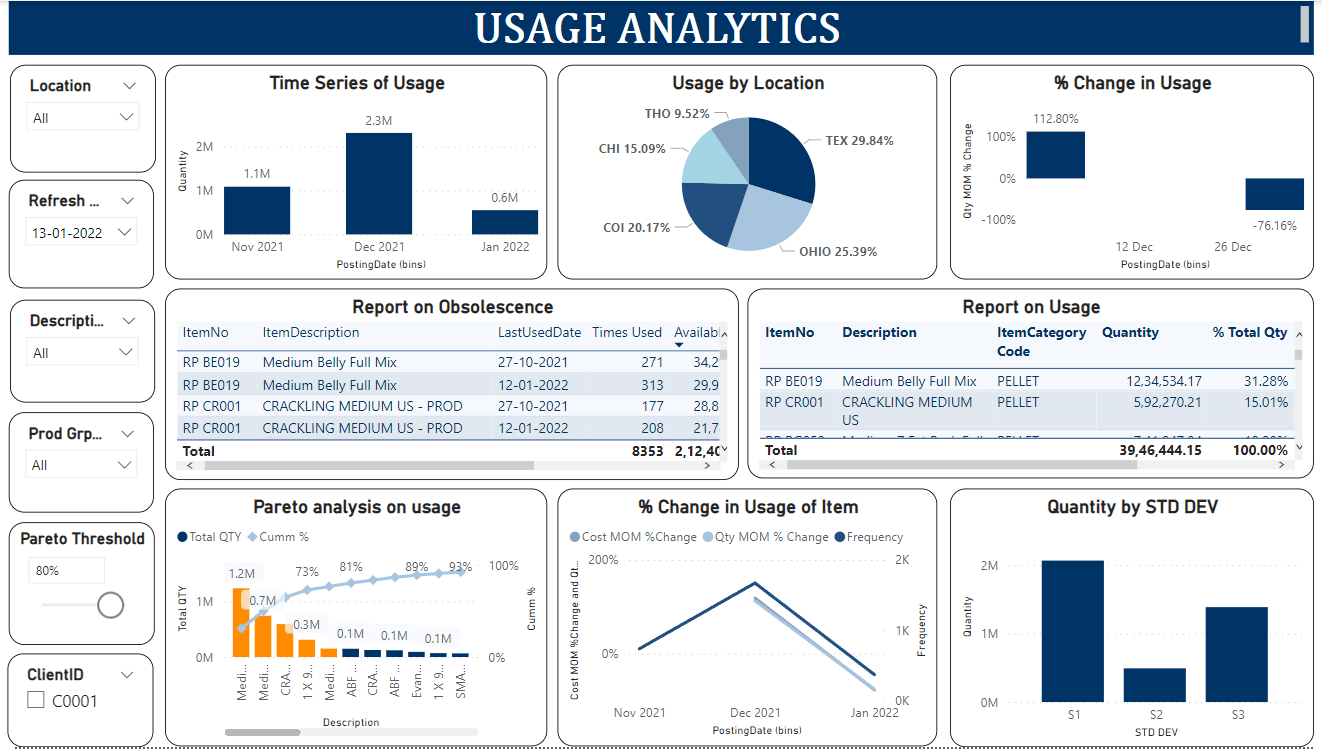
We implemented an advanced dashboard that offered a richer look and feel, providing insights through interactive visualizations with customizable filters. Various visualizations, including Charts, Funnel, Tree, Cards, and Tables with Sparklines, were implemented by customizing the Power BI themes. Additionally, features such as drill-through, drill-down, export, and slicers were incorporated to enhance data exploration and analysis.
Business Outcome:
The implementation of the new Power BI dashboard resulted in significant improvements in the client’s project management status reporting system. The dashboard’s enhanced visual appeal and interactivity empowered stakeholders to extract insights more efficiently, leading to faster decision-making and deeper insights into project performance.
Moreover, the dashboard’s alignment with the company’s branding standards improved user engagement and adoption. The inclusion of drill-down and drill-through functionalities enabled users to delve deeper into the data for more detailed analysis, further enhancing the dashboard’s utility and effectiveness.


