


Embarking on the journey of harnessing valuable insights from diverse data sources can be both an exciting and challenging task. In a recent project, our team grappled with the complexities of collecting, validating, cleaning, transforming, and securely storing data sourced from large Excel files. This voyage led us to leverage the powerful capabilities of Azure Data Factory and Microsoft Power BI to not only streamline the data but also present a visually compelling and interactive dashboard to end-users.

The Data Landscape:
The first challenge we encountered was the heterogeneous nature of our data landscape. Information sprawled across various raw files, bringing them all together in a way that makes sense was like solving a puzzle. However, the scattered nature of these sources meant that unifying them into a coherent structure required meticulous planning and execution.
Azure Data Factory: Orchestrating the Symphony of Data:
Enter Azure Data Factory, the orchestrator of our data symphony. This cloud-based data integration service proved to be the essential in automating the end-to-end data pipeline. Through seamless connections to diverse data sources, Azure Data Factory facilitated the extraction of relevant data, enabling us to bring order to the chaos.
Validation and Cleaning:
Data integrity is paramount, especially when dealing with multiple sources. Azure Data Factory’s robust validation mechanisms allowed us to ensure the accuracy and reliability of our data. Cleaning processes were streamlined, eliminating inconsistencies and redundancies, laying the foundation for a dataset that could be trusted for decision-making. We also cleaned out anything extra or confusing, so our data is report ready.
Transformation for Meaningful Insights:
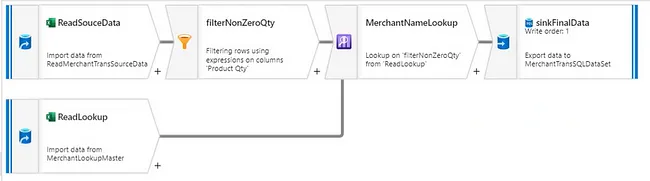
Transforming raw data into meaningful insights requires a combination of finesse and efficiency. Azure Data Factory’s Data Flow transformation capabilities empowered us to apply business rules, aggregate metrics, and derive new dimensions, crafting a dataset tailored to the specific needs of our project.
Secured Storage: Keeping Our Data Safe
Security is non-negotiable when dealing with sensitive information. Azure Data Factory seamlessly integrates with Azure Data Lake Storage and Azure SQL Database, offering a secure haven for our curated dataset. This ensured that our data fortress was fortified against unauthorized access, adhering to the highest standards of data governance.
Microsoft Power BI: The Art of Visual Storytelling:
With the data securely housed, the next challenge was to translate it into a compelling narrative. Power BI emerged as our visualization maestro, transforming data into insightful visualizations and interactive dashboards. The drag-and-drop functionality, coupled with a rich array of visualization options, empowered us to craft a dashboard that not only conveyed information but invited users to engage with the data actively.
Interactive Dashboard:
Our journey culminated in the creation of a dynamic and interactive dashboard showcasing a multitude of metrics in different formats like charts, tables, matrix and card visualizations. From key performance indicators (KPIs) to trend analyses, users could explore, filter, and drill down into the data, gaining deeper insights.
Conclusion:
In navigating the data odyssey, we discovered that Azure Data Factory and Microsoft Power BI are formidable allies. Our adventure with Azure Data Factory and Power BI not only showcased the power of these tools in wrangling diverse data into meaningful insights but also emphasized the strategic decision-making involved in choosing the right solutions for our project. While there are other robust services available, we opted for the Azure Data Factory and Power BI combination. Why? Because this duo perfectly fulfilled our customer’s reporting needs while also being mindful of the budget constraints.
Our decision to leverage Azure Data Factory and Power BI not only addressed the immediate needs of our project but also ensured a sustainable and cost-efficient approach to reporting. As we wrap up this chapter of our data journey, it’s clear that sometimes the best solution isn’t just the most powerful one but the one that strikes the right balance between capability and economy.
Author: Prakash Somasundaram – Chimera Technocrat
Prakash Somasundaram is a technical professional with over 22 years of experience in the IT industry, currently serving as a Principal Technology Consultant at Chimera Technologies. In his role, he focuses on architecture design, technical solutioning, and pre-sales activities. He specializes in full-stack development using the Microsoft Technology Stack and various open-source frameworks. He is passionate about system architecture design, data analytics, data engineering, artificial intelligence, and machine learning. Prakash leverages his expertise to drive innovation and deliver impactful solutions.